
Beautiful Week of Volatility

hi friends,
I will be highlighting my thoughts going into and during each day of the week I was present starting with Wednesday, February 2nd.
I will try my best to keep each section brief as the intricacies themselves can be detailed in future posts.
This was my tweet on Tuesday going into Wednesday.
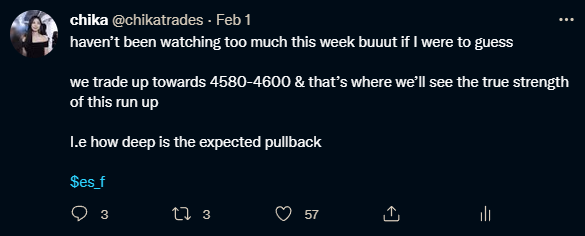
As you can see what transpired Wednesday, we did explore 4580-4600 area (HOD 4585) followed by a sharp reversal lower from poor tech earnings.

The reason why 4580-4600 was a likely area of interest to test is followed by the context from past 1-2 weeks.
Higher lows created, followed by a “dead-cat-bounce” from heavily oversold conditions & change in tape characteristics where buyers began to absorb what sellers were throwing them, thus paving the way for higher prices.
And if the path of least resistance becomes to the upside, then we look for the next pocket of liquidity ahead of us which on the weekly profile, shaped out to be 4580-4600 region (more details on this on previous posts).
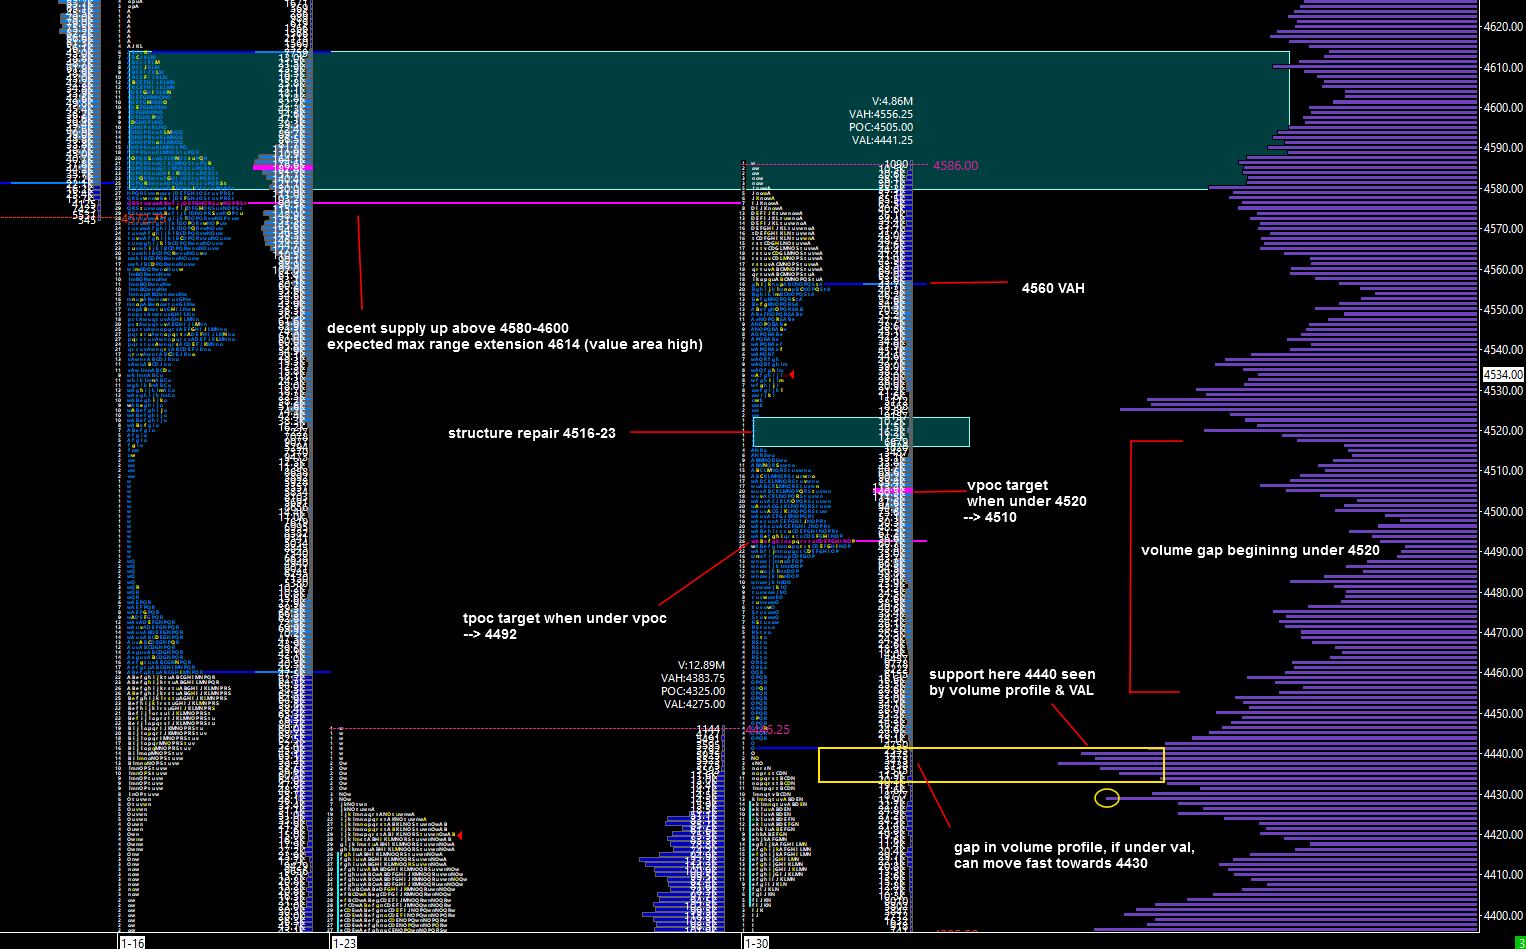
In this scenario, what is likely certain is a retest of this area of supply & what is uncertain is the event that occurs afterwards.
Remember, we had quite the orderly oversell the past 2-3 weeks and for the tape to quickly restore confidence in itself after much fear had been instilled in investors is a tall order.
Lot of these upper movements have been trading as exit liquidity i.e spikes get sold off which makes sense in the current market context, thus the likelihood of seeing volatility increases as prices increases.
I don’t believe I was reading the tape on Wednesday & based my assumptions on prior market context & raw chart information but I digress.
This move from 4585 quickly paved way to 4532 followed by 4464 the next day +121pts.
This is where it gets interesting as I arrive back to my workstation and begin to read what the tape is saying on Thursday & Friday.
We’ll be using my tweets as time stamps.
Wednesday Feb 2nd after the close, I reiterated my weekly outlook on the market
I remained confident all rallies will remain sold as long as 4580-4600 caps all gains on ES_F because that is what the tape & market conditions were telling me.
A lack of confidence to hold the bid at higher prices.
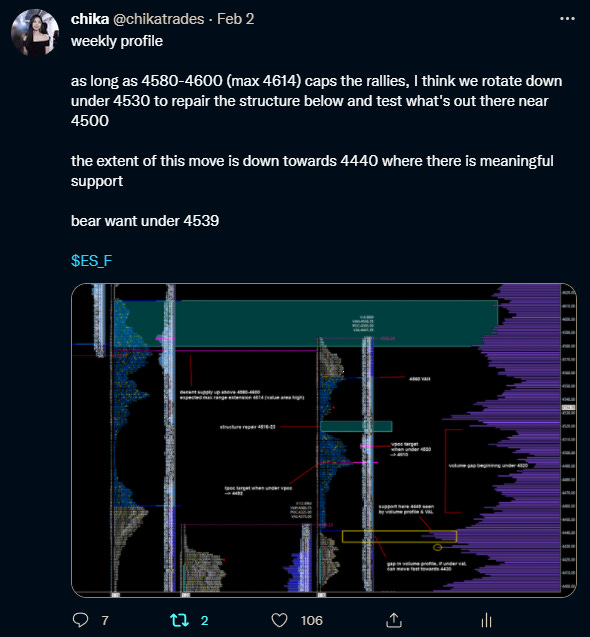
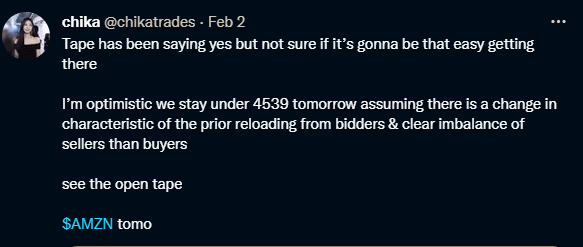
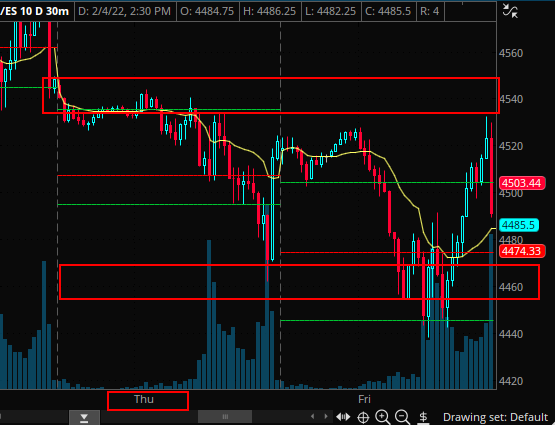
If this thinking in mind paired with the existing market conditions of fear is highly probable, then I need to see prices accepting lower under the prior day’s value area low which was 4539.
Thursday open, February 3rd
Prices indeed remained bid under 4539, demonstrating the lack of confidence of market participants to hold the bid.
Plus who wants to be holding on a Thursday??
Now let’s go over Thursdays context.
We had a very obvious sell all rally type of day after selling 50+ handles from poor tech ER on Wednesday, so sentiment itself flip flopped quickly from bullish to bearish.
Because of this, holding a now-obvious position becomes more dangerous as more participants and sentiment shift towards the same side and we know where that tends to lead.
But you never want to just simply buy blindly, but rather wait until the tide shifts from the market generated information (MGI).
There were 2 primary tools I was using to navigate Thursday, the Depth of market (DOM) & the tape.
We’ll start with the tape.
I can only briefly describe the characteristics of what I look for in the tape so use your imagination here and/or prior tape experience.
(I will talk more in detail of the intricates of the tape in another post)

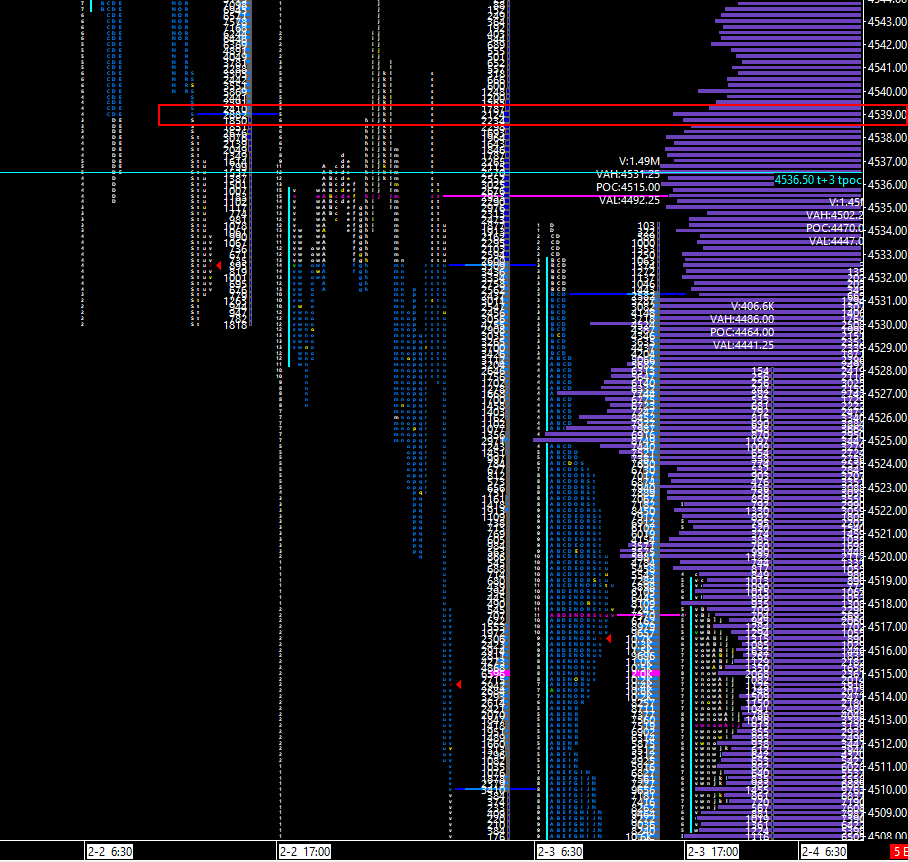
Here is a raw snapshot of the tape I use for ES_F.
The tape is nothing more than a transcript of prices from buyers and sellers.
For example, on my tape, 33 = 4533 and so on; it is set to significant figures for easier reading comprehension. The number in the middle represents the quantity transacted with respect with price & the text next to it represents the condition.
If we begin at the bottom, “33” represents 4533 with 20 lots filled at the bid i.e x20 lots were sold at the market filled at the bid.