
2/8 Thesis | Regime Shift

Disclaimer: not financial advice, just my own opinion.
hi friends,
Interesting week of development so far and it’s only Tuesday.
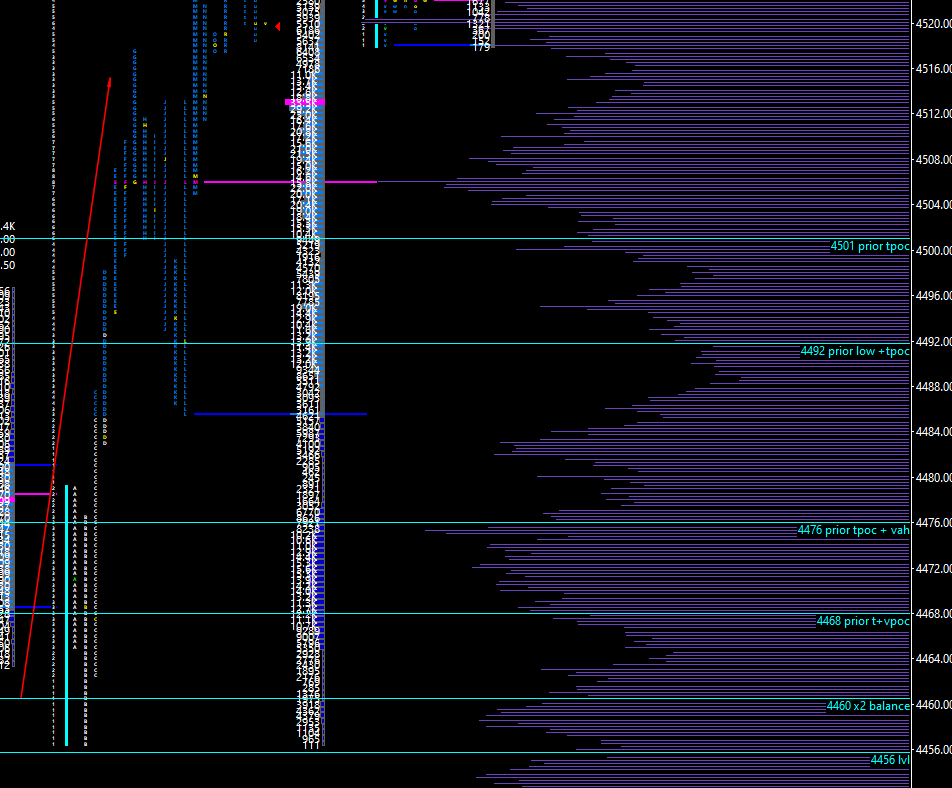
For visual representation, this is my DOM and tape from Jigsaw.
Post about this from me will come later, detailing my interpretation of this tool but if you are interested, Fader has a good substack post regarding this tool.
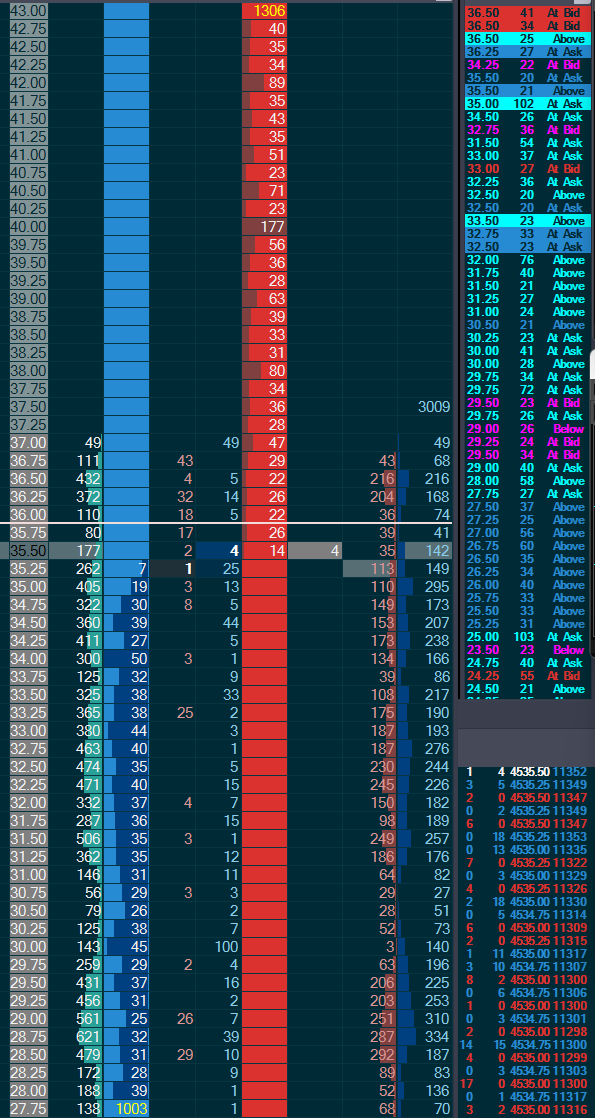
I’ll be going over how I saw the day progress and how things have been shaping up for the market with topics touching on seeing interactions at levels of “significance” / tape & dom behaviors / monitoring for development / cumulative delta, etc.
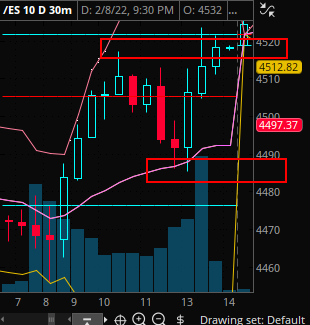
Here is a visual representation of price on a candlestick chart going into RTH open & middle of the day (red) and my thoughts going into the cash open.

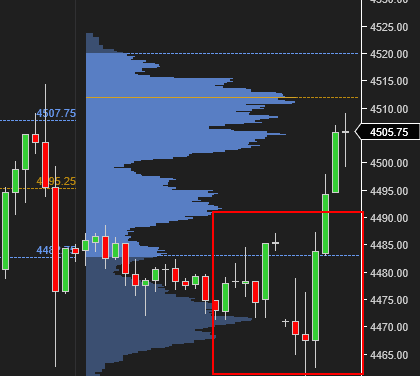
At the open, prices explored lower as we were under 4492 pivot which took us down to test both 4470 and 4480.
This is where observation comes into play for the first 30 or so minutes because the front of the open involves a mixture of traders cleaning up and/or adding to positions which leads to the expected volatility nature at the cash open.
As we opened under 4492 and 4480, prices did not trade 4480 at all for the first 30-60minutes (seen through A-B period, which represents the initial balance).
We paved ways down towards 4456 but at the open I am not trying to play if the price is right at this particular time but instead focusing on monitoring for development.
Let me explain.
When prices opened and bearish flows swept the tape and price action, I am watching the interaction between buyers and sellers, momentum, and time at their respective prices.
In the diagram above, 2 things
1) 4480 pivot here, open was under 4480 and the initial balance (IB) range didn’t even touch it
2) OVN auction sold into the open
Just off these 2 pieces of information we can conclude there is a lack of confidence from buyers and in the current circumstances of the market it makes sense.
At the cash open, the open order flow agrees with this thinking and begins to explore lower prices (this is where we take it “level-by-level”.
For example, once we’re under 4460, we look for the interaction at 4450 and important level 4440 in addition to monitoring tape tempo, friction, nuances, etc.
Again, the first 30 minutes for me isn’t to play guess where the price is right.
It is a time to validate or adjust my current thesis of what I think is going on.
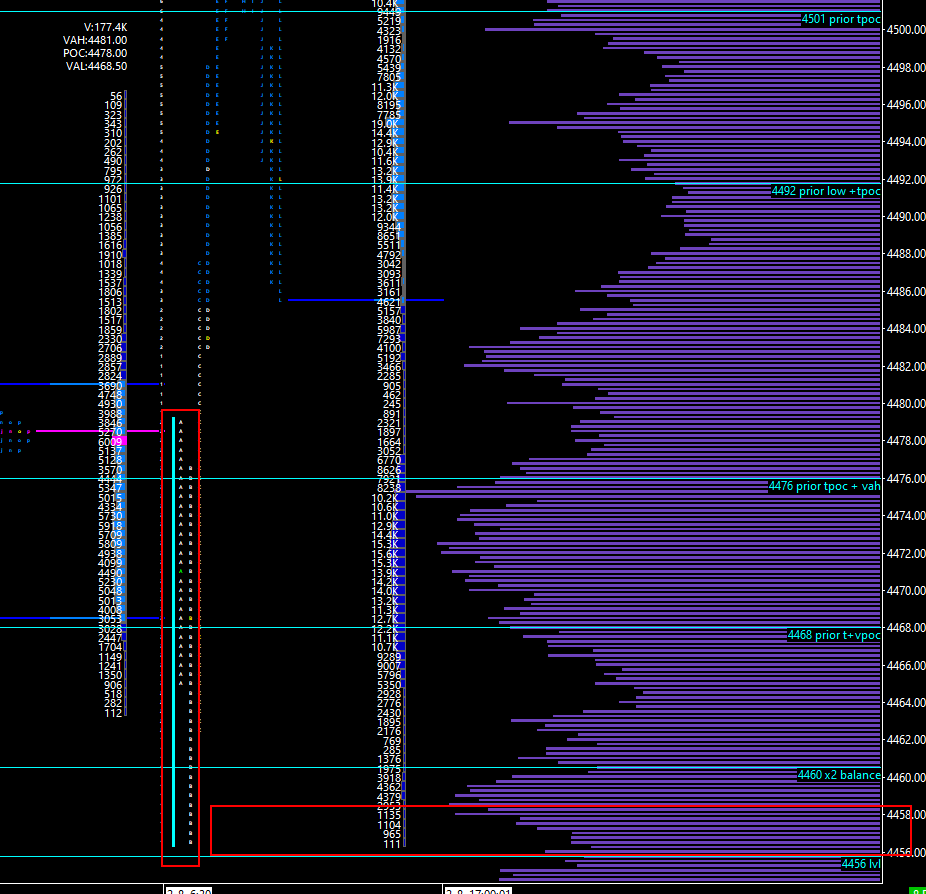
Highlighted in the next red rectangle over is my volume profile & you can see there is about 111 and 965 contracts traded around 4456, which represents very little time and volume spent at the lows.
So far we have these facts in mind from the cash open in mind
1) poor confidence in the market from buyers described by the clues above
2) lack of interest to hold prices lower (for now)
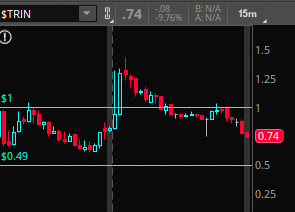
We can add other factors such as market internals and large caps etc, like trin opened pretty high today but I want to keep the focus of the post on ES_F and you can read Tics detailed description of market internals if you’re interested.
(Trin up and climbing up = additional conviction with the sell at open context)
This is the basic gist of what I got at the open.
The point of this data collection & observation is to collect our interpretation of the factual market generated information to piece together the story of buyers and sellers.
What is not explained in this post is the context that was leading up to today’s session.
1) seller presence remains in the market
2) buyer presence has been populating sparsely that has been showing a greater presence relative to 1-2 weeks ago, it’s mildly subtle but the lack of confidence end of day still remained (HOWEVER, Monday’s eod close spooked a lot of these buyers)
3) prices reattempted an assault towards the 4200-4400 lows but were unable to move lower
4) large caps like tsla amzn were coiling with higher lows, structurally big move looks to be coming, up or down determined at the close of today’s session and/or tomorrow
—-
(There are more clues that I can tack on but for the sake of this post, we’ll stick with these 4. The purpose of me writing this out is to emphasize my observation-like thought process.)
—
You hear me say the word ‘change’ a lot, which became engrained in my head when learning from James Dalton.
Trading is all about change, but you don’t know what change is until you have raw data to compare and define change & that is where screen time + collecting and observing notes come into play to define change.
With these facts in mind, we are aware buyers are demonstrating some spurts of confidence but the order flow at the moment has been seller dominant.
Now we watch the order flow and interactions level by level with these facts in mind.
Prices after the initial balance went bid over 4480.
This was where 4480 becomes new support if strong and makes an attempt at the next pivot 4492.
Prices went bid, one time frame up (OTFU) towards 4516. Characteristic and nature had shifted bullish from bearish.
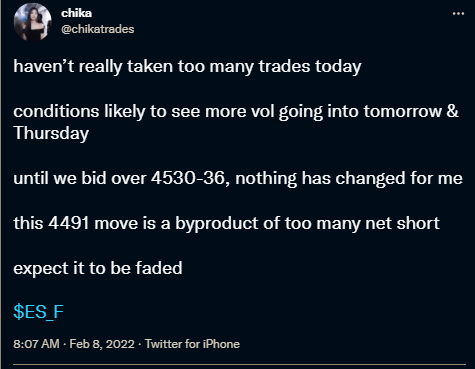
I sent this tweet out reiterating my stance that I was not that confident in buyers until I saw 4530-36 reclaimed and that the theme remained all rallies to be sold until proven otherwise.
At the time, I personally wasn’t too confident in being long so I took about 2 short attempts at key levels like 4492, 4506 with a tight 3-4 pt stop on the way to 4512-20 but got stopped out on the first 2 attempts for being too early.
3rd attempt at entering short at a better deal was a success.
What also helped with this trade was the confluence of where price was & the divergence between cumulative delta and price, which in this case, signaled a decline of market buy orders in the market relative to the uptrend in price.

These are pieces of the market generated information I can show you as I do not have images and/or videos of the dom and/or tape sadly to share here but believe me I use the DOM & Tape as a guide always to lead decision making processes but up until this point, the only nuance on the tape was the poor job of sellers and seemingly lack of fear from buyers at the time.
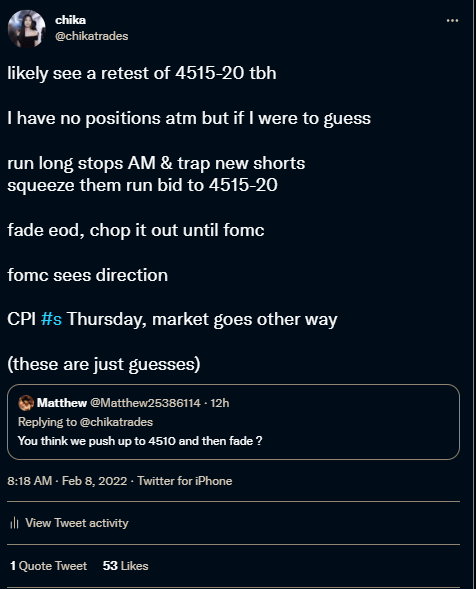
I presented 2 options from here of where price would likely trade, where 2nd option was preferred (see below).
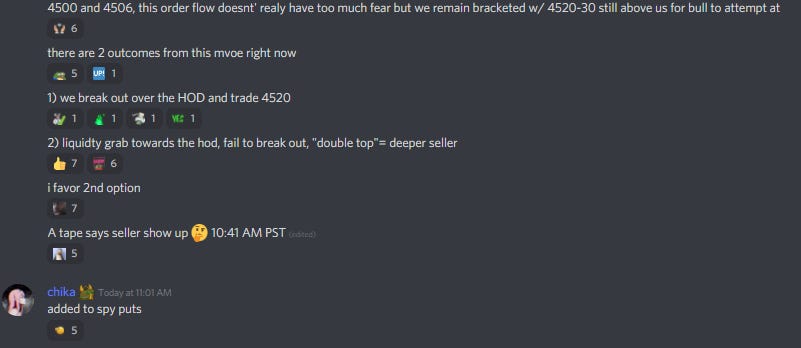
Prices went bid into 4515-20 region, rejected, sold down 4492 per plan.
DOM & tape agreed with me but it took some time to manifest as you can see it reattempted at move at the hod but failed taking long stops out.
Rotation under 4500 led to a retest of 4492 as well as session vwap 4486.
Now this is where it gets interesting.